An Introduction to Gamma Spectroscopy
This is a draft of my article on Gamma Spectroscopy for a zine called Hardware Thrashers of X.
Intro
Every second, thousands of high energy particles, sheared off of atoms by radioactive decay, collide with your body. Most pass through harmlessly. But each carries a signature: its energy fingerprints the exact isotope that spawned it: potassium-40 from your breakfast banana, cesium-137 from reactor fuel, tellurium from distant supernovae.
For decades, reading these fingerprints required photomultiplier tubes, cryogenic cooling, and equipment costing tens of thousands of dollars. Not anymore. Gamma spectroscopy has become surprisingly cheap. With about $200 in parts and a Saturday afternoon, you can build a device that identifies isotopes by their gamma signatures.
This article is your field guide: we’ll cover what gamma spectroscopy can do, how the physics works, the signal processing that extracts clean spectra from messy detector data, and walk through a low-cost, high-performance gamma spectroscopy system of my own design.
I don’t live in Chernobyl, why should I care
Gamma spectroscopy isn’t just for detecting nuclear accidents or uranium ore: gamma particles are EVERYWHERE. There is enough potassium-40 in the average banana to produce about 15 gamma particles per second.
A given gamma-emitting radioactive isotope will produce photons of different energy levels, each emission random, but with a consistent probability distribution. These spectra are like atomic fingerprints which we can use to detect and identify gamma-emitting particles.
Gamma spectroscopy is used to monitor star formation millions of light years away, test food (bioaccumulation of gamma-emitting particles), analyze soil ecology (distributions of isotopes correlated with various geological, seismic, and ecological trends) and map geological features (attenuation of gamma particles by heavy deposits).
High energy spectrum data can shed light on atomic processes happening all around us—in the dirt below and in the distant stars above.
How gamma spectroscopy works
Most people are familiar with the visible light spectrum: any light source can be characterized as a spectrum describing the relative intensity of each frequency. The electromagnetic spectrum extends to lower frequencies, like the IR used for thermal cameras, and to higher frequencies through UV. But that’s not where the EM spectrum stops.
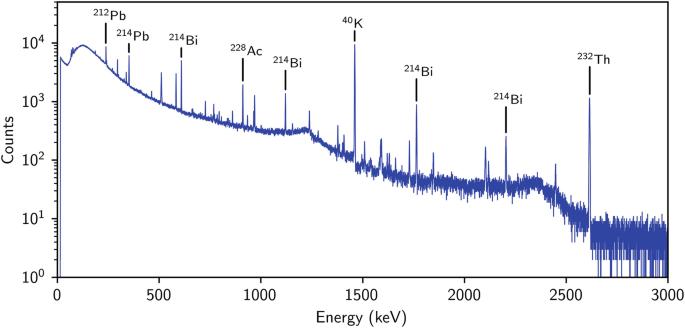
At the very high frequency end (>10^19 Hz) there are gamma ray photons. Particles of this intensity are generated by atomic processes associated with radioactive decay of unstable nuclei. The energy level (measured in kilo- or mega-electron-volts) of a given particle is a function of the atomic structure of the nucleus which ejected it. Each radioisotope has a characteristic emission profile — particles of specific energy levels that it emits that show up like fingerprints when you collect enough particles. A single gamma ray tells you almost nothing. But sample a few thousand decays, and the histogram reveals exactly which nucleus spawned them:
Note: Although we are calling this all “gamma spectroscopy” and focusing on gamma ray photons, a bare or thin-windowed scintillator can also pick up beta particles, and to a lesser extent high-energy alphas, though encapsulated crystals like most NaI(Tl) and CsI(Tl) will stop alphas and low-energy betas before they reach the scintillator.
Scintillators and Silicon Photomultipliers (SiPM)
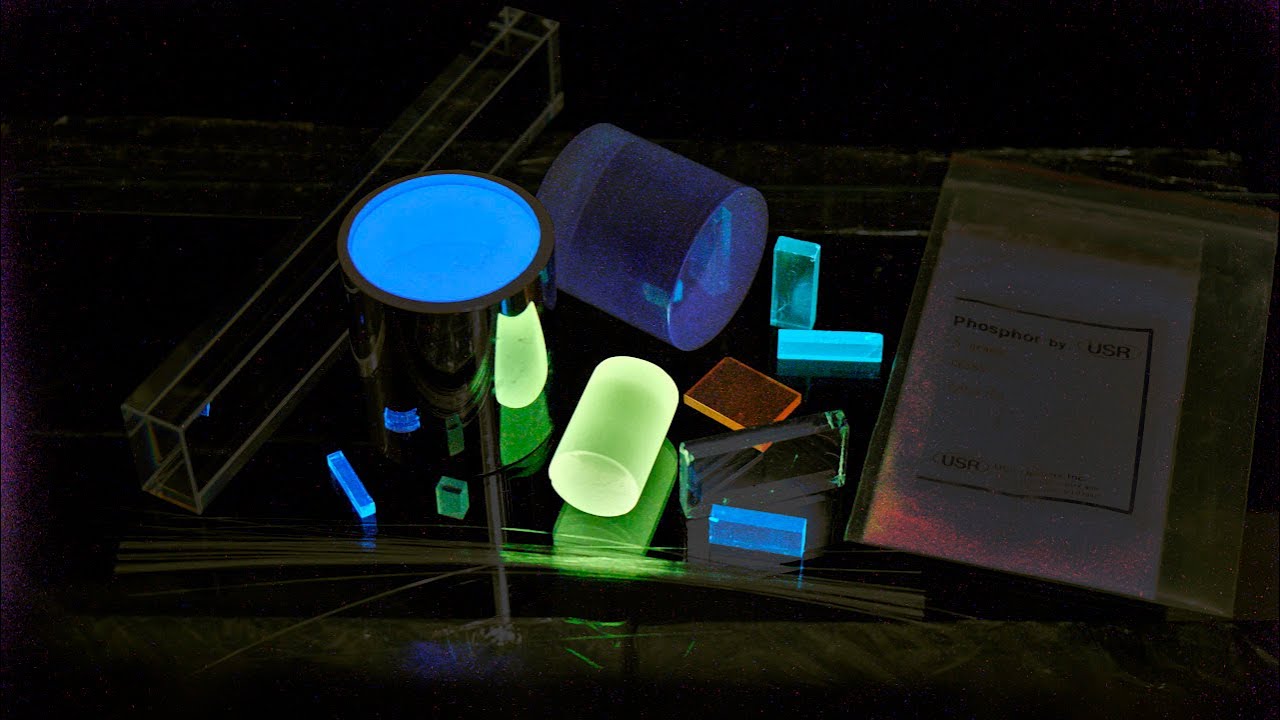
The challenge with gamma spec is that high energy particles are, generally, extremely difficult to measure. They are far too energetic to interface with electronics directly. Scintillators are the magical crystals which bridge this gap and enable low cost, high resolution gamma spectroscopy. Scintillators are used to “down convert” the high energy particle to a number of lower energy photons. Put simply, when you shoot a scintillator with radiation particles, it produces some amount of light (often visible light) proportional to the energy of the particle which hit it. One 1460keV gamma particle becomes tens of thousands of ~2eV 550nm photons. A detector is created by pairing this scintillator with a light sensor which can measure the brightness of secondary emissions.
But in reality, things are a bit more complicated. Each scintillation event produces all the photons in a brief flash lasting hundreds of nanoseconds to microseconds depending on the crystal. To precisely measure the amplitude of these brief pulses, we need a highly specialized sensor:
An SiPM is essentially an array of thousands of tiny photocell pixels, all wired in parallel to the SiPM anode (A) and cathode (K). When a scintillator flash hits the array of photocells, photons “avalanche” individual pixels connected in parallel, allowing current to flow from K to A. The forward current induced by these avalanches adds up proportionally to the number of incident photons (∝gamma ray energy). Compared to traditional photomultiplier tubes, which run on high voltage supplies and cost hundreds of dollars used, SiPMs run on ~30V, and can cost under $20. The scintillator crystal needs to sit directly against the SiPM face, wrapped in reflective foil. Often scintillator crystals are surrounded by highly reflective ceramic baring the face the SiPM sits on. The whole assembly gets wrapped in tape and put in an enclosure to further shield the assembly from stray photons.
The output is a current pulse: brief (nanoseconds), small (microamperes per cell, but we need to resolve differences between individual cells firing), carrying the energy information you need. From here we just need a circuit to amplify, shape, and measure this pulse so a microcontroller can histogram it into a spectrum.
Building a Gamma Spec Driver
WARNING: My board is still V1. I have gotten some promising results out of it, but I have some fixes and optimizations to make. I will release a new version soon with all the design+SPICE files available. watch my GitHub (@eigenlucy) and website (eigenlucy.com)
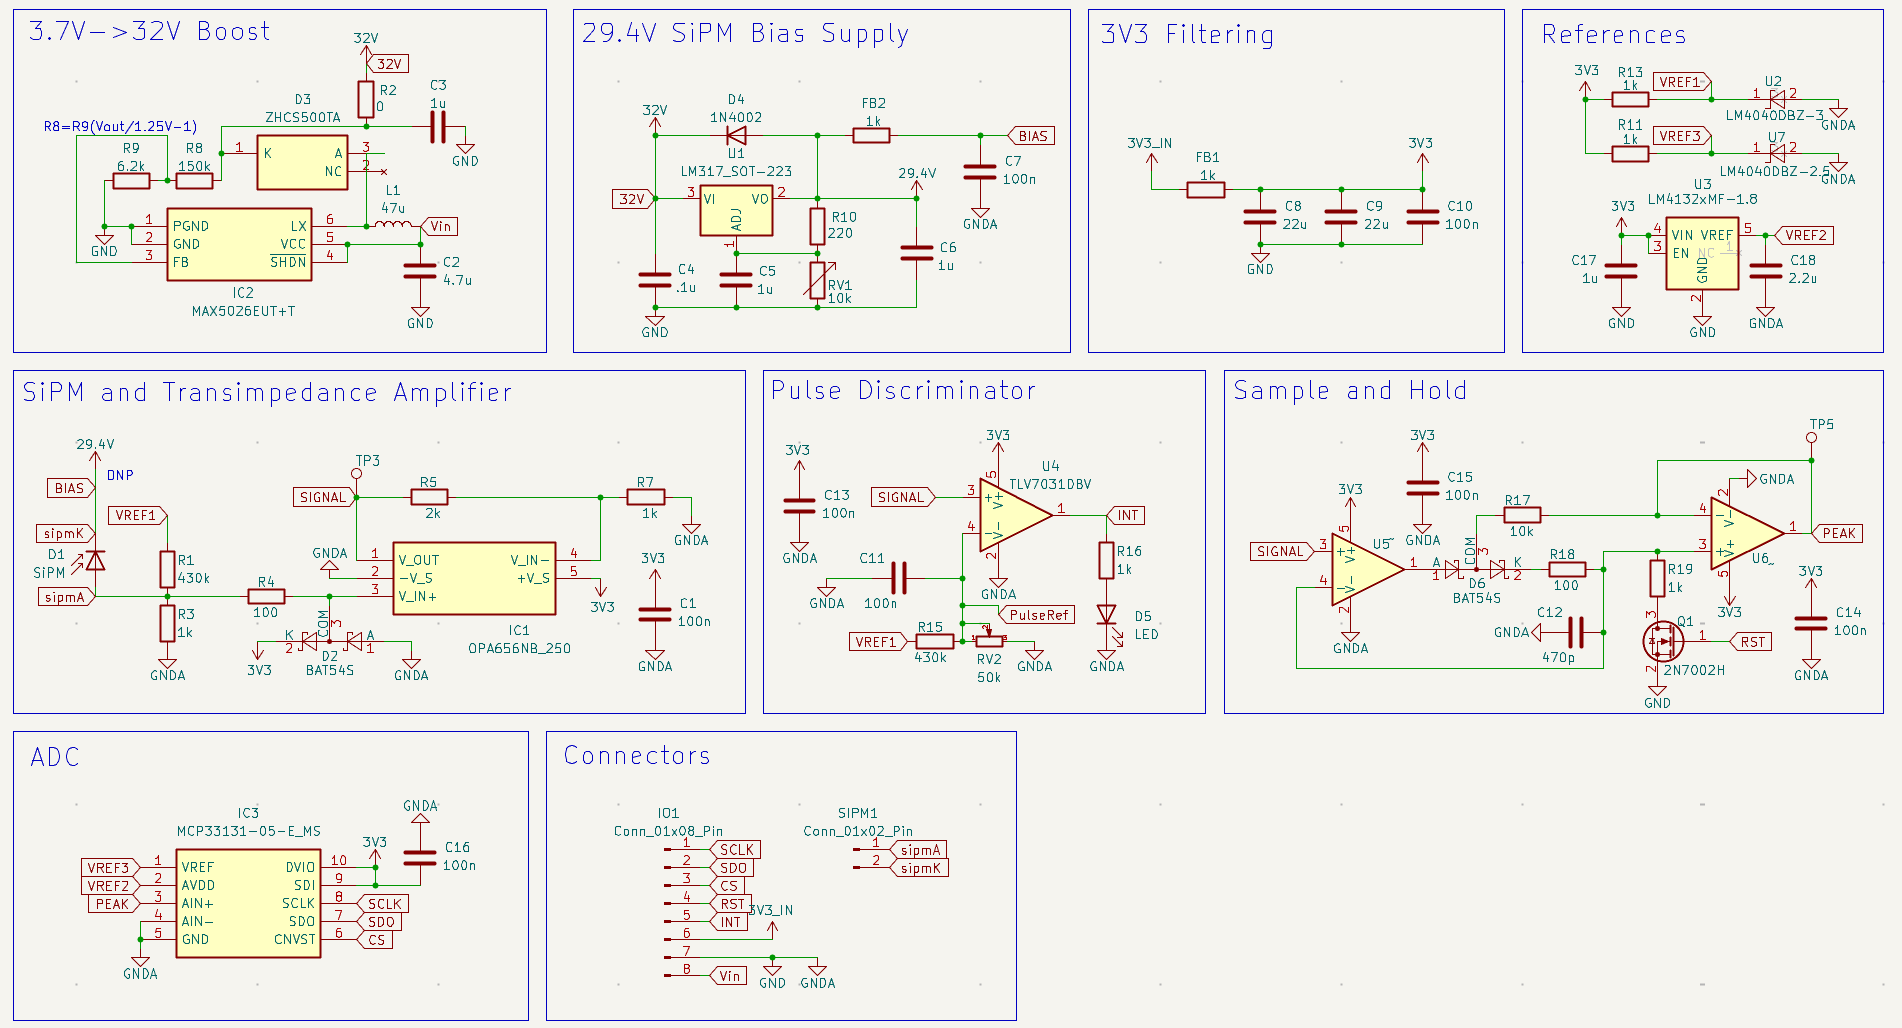
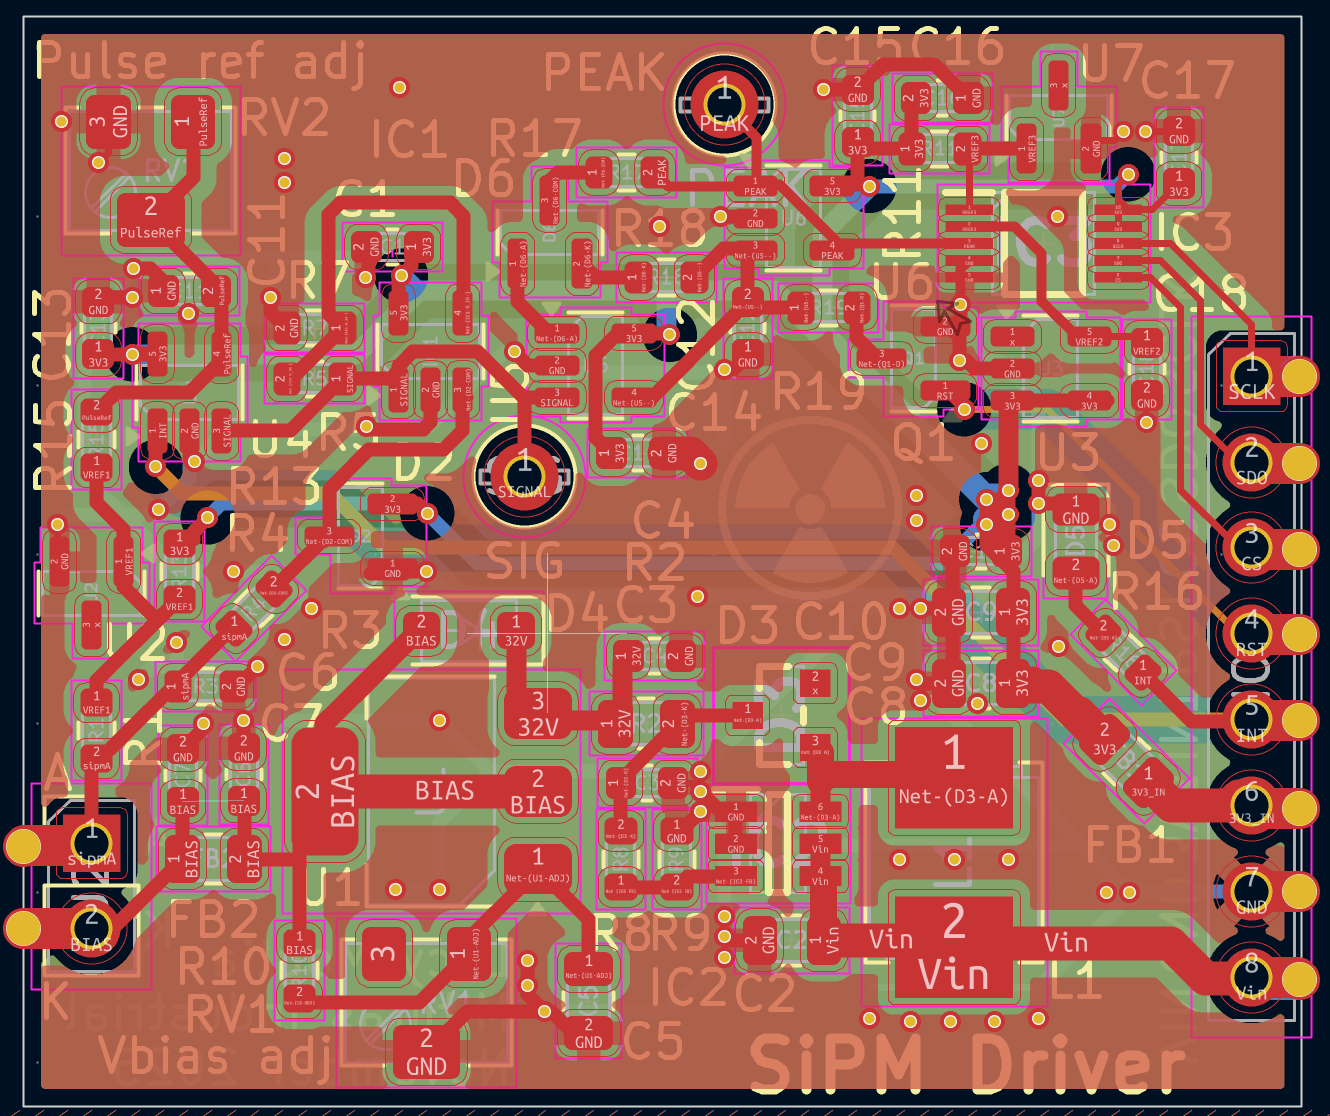
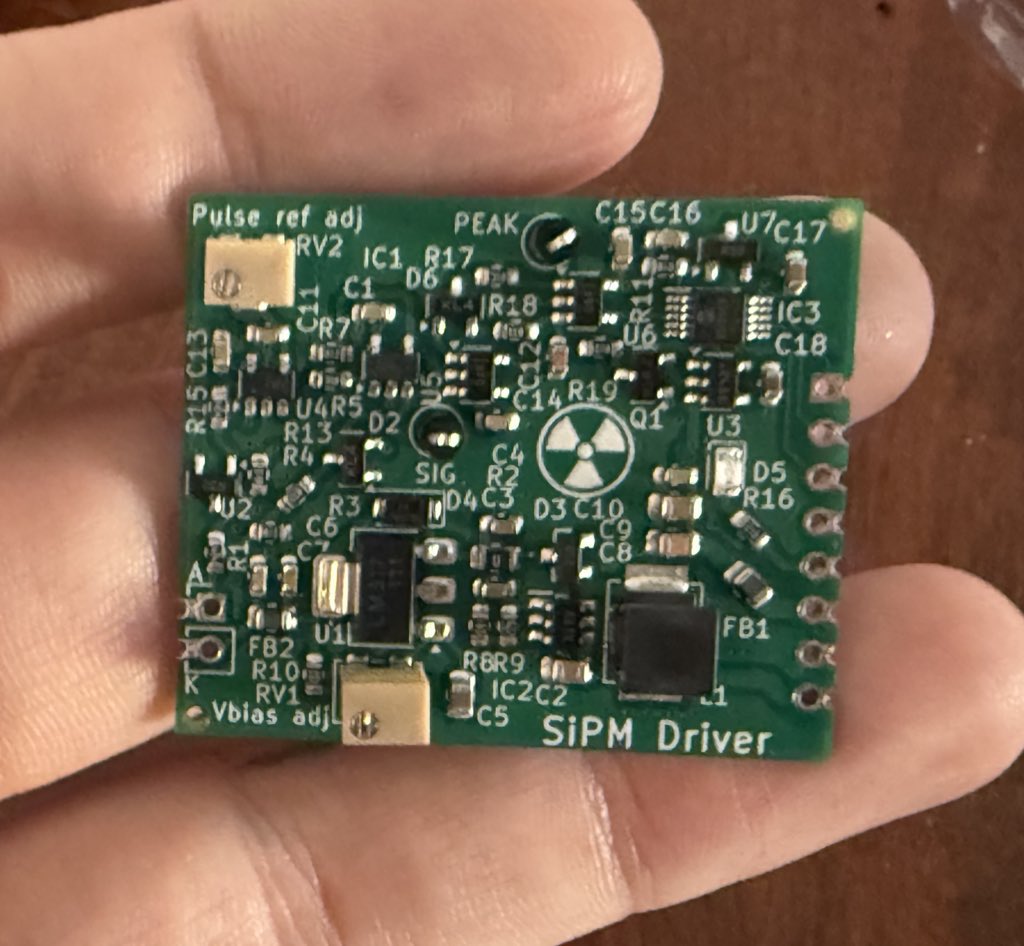
This is the board I built to interface with an SiPM and scintillator pair. It is heavily inspired by the amazing open-gamma-detector project. I know it looks intimidating, but it’s pretty intuitive.
On a high level we have to build: a bias voltage generator for the SiPM, an amplifier to convert the current pulse to a readable voltage, a pulse discriminator to send a digital interrupt when a pulse occurs, a peak detector to hold the peak voltage out of the amplifier (used for histogram), and an ADC to record the peaks. Let’s go through the circuit.
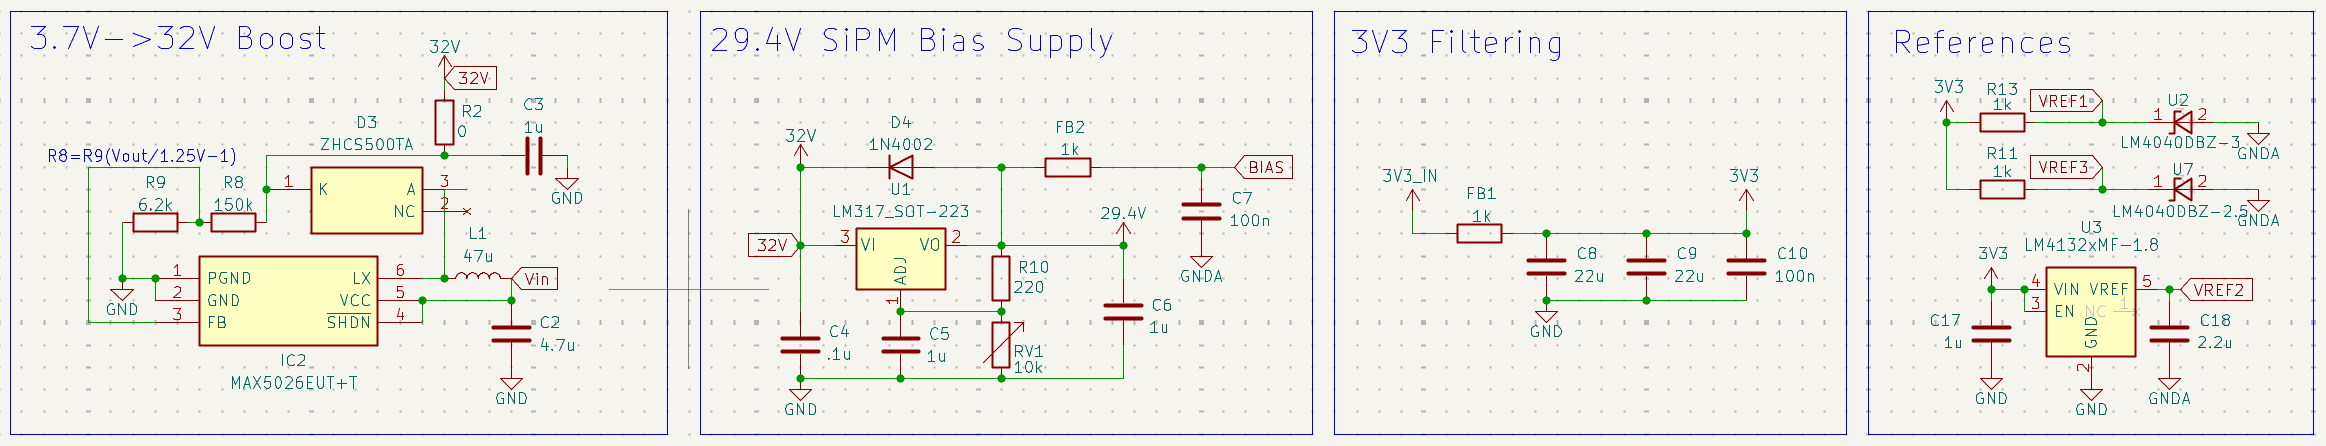
SiPM bias voltage generator:
A bias voltage must be applied to the SiPM to hold charge across the photon sensitive junction. Bias voltage tends to be between 25 and 35 volts, depending on the photocell. I used a MAX5026 boost converter to generate this from a battery. We need this bias to be smooth — ripple on the bias modulates the SiPM gain, smearing energy resolution — so I used an LDO linear regulator after the boost. My board allows Vbias adjustment up to 36V.
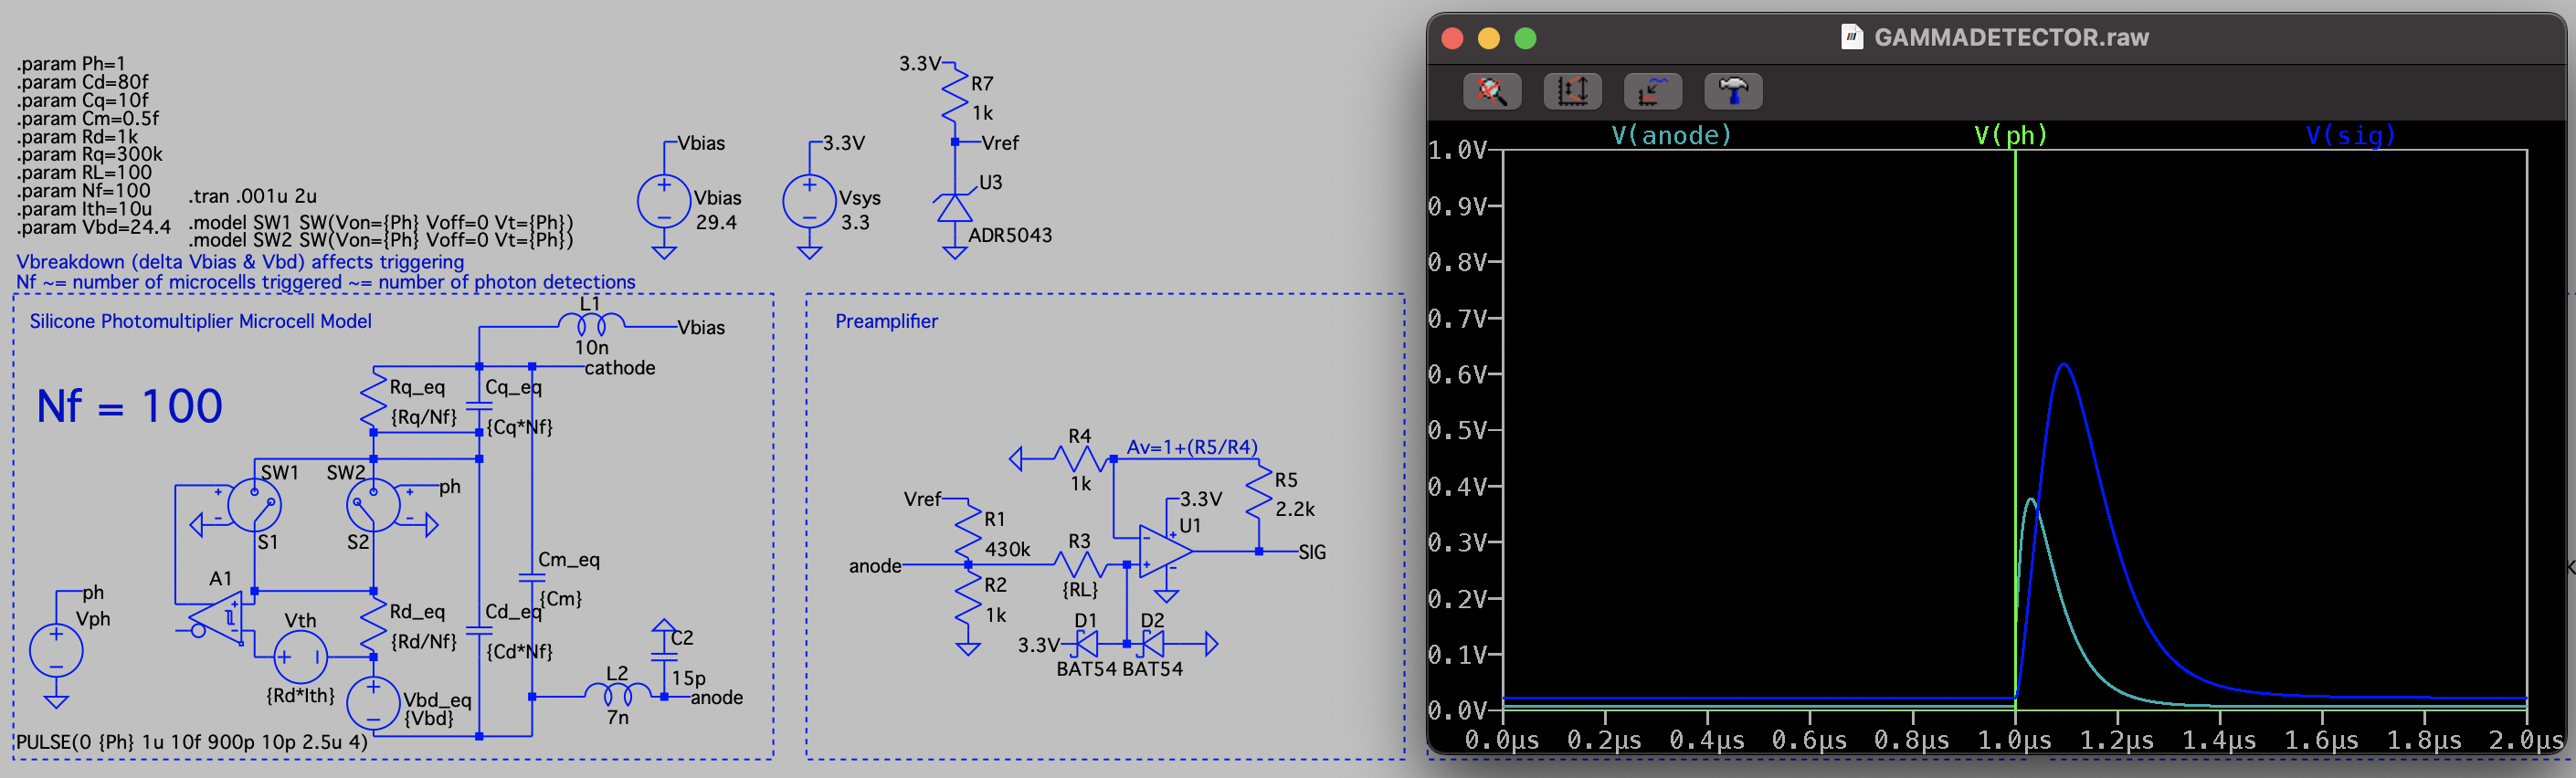
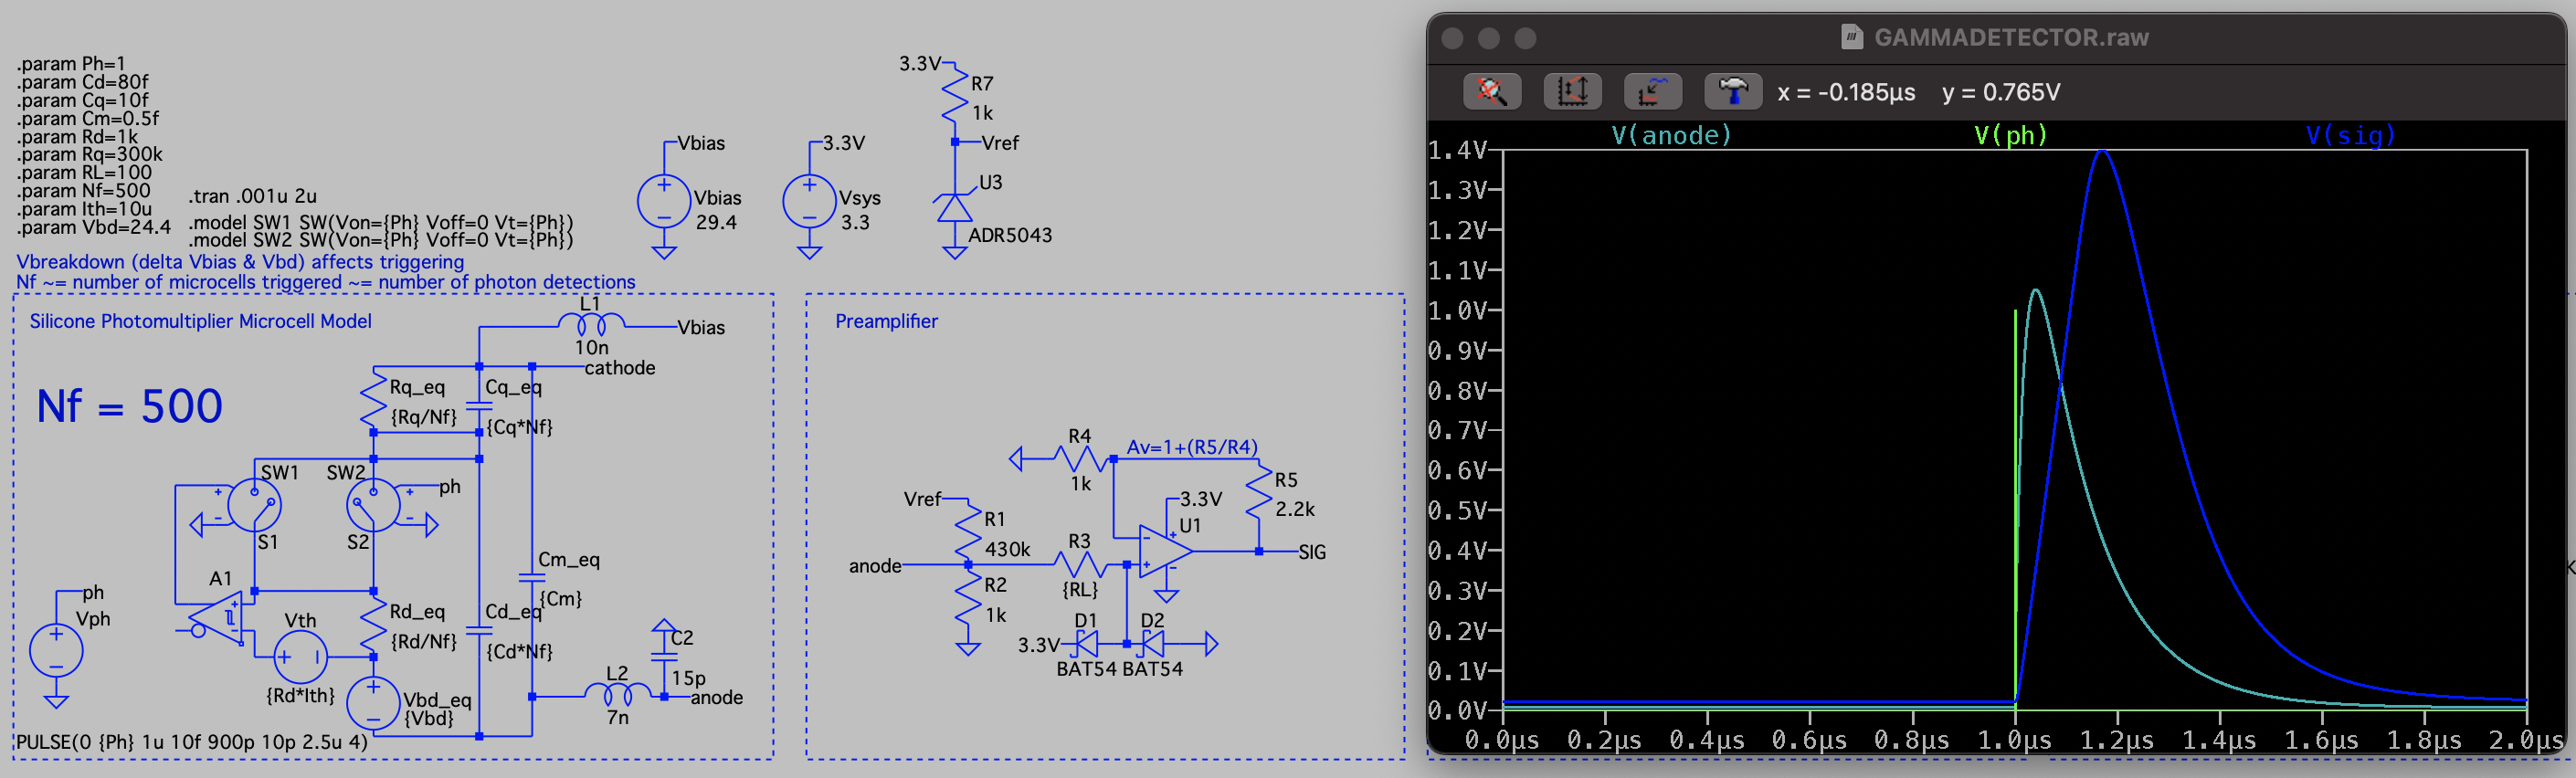
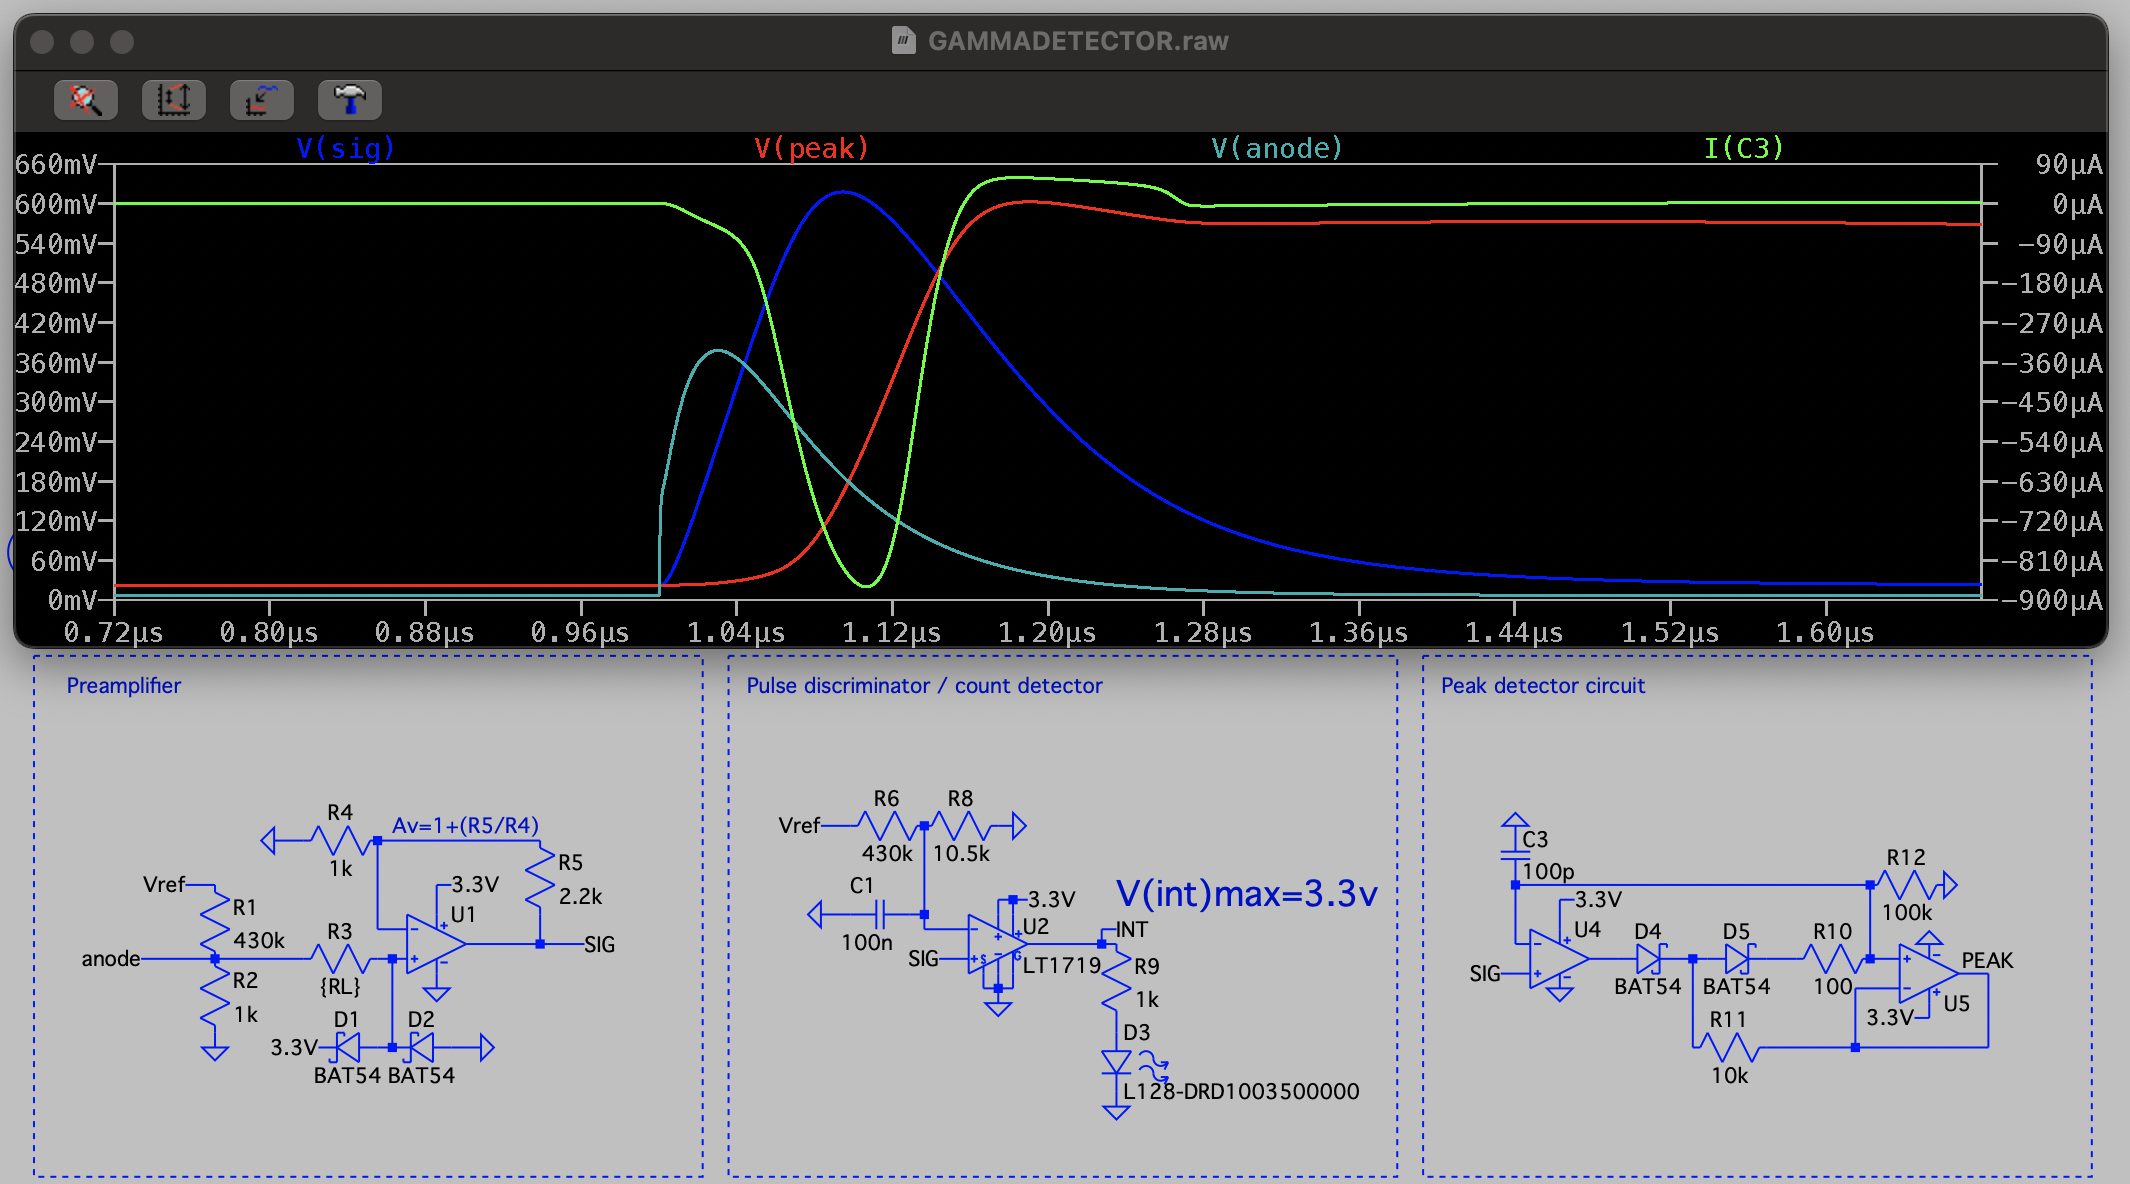
Transimpedance amplifier (TIA):
A transimpedance amplifier (TIA) converts current to voltage. The SiPM outputs a brief pulse of current when the photocells trigger. The gain is fairly low, but high bandwidth is required: the raw SiPM pulse is nanoseconds wide. The anode, connected to the TIA non-inverting input, is held a bit above 0V with a reference produced via zener diode and voltage divider for stability. When the amplifier works correctly, the number of cells that fires determines the peak output voltage, which we can read to measure incident particle energy.
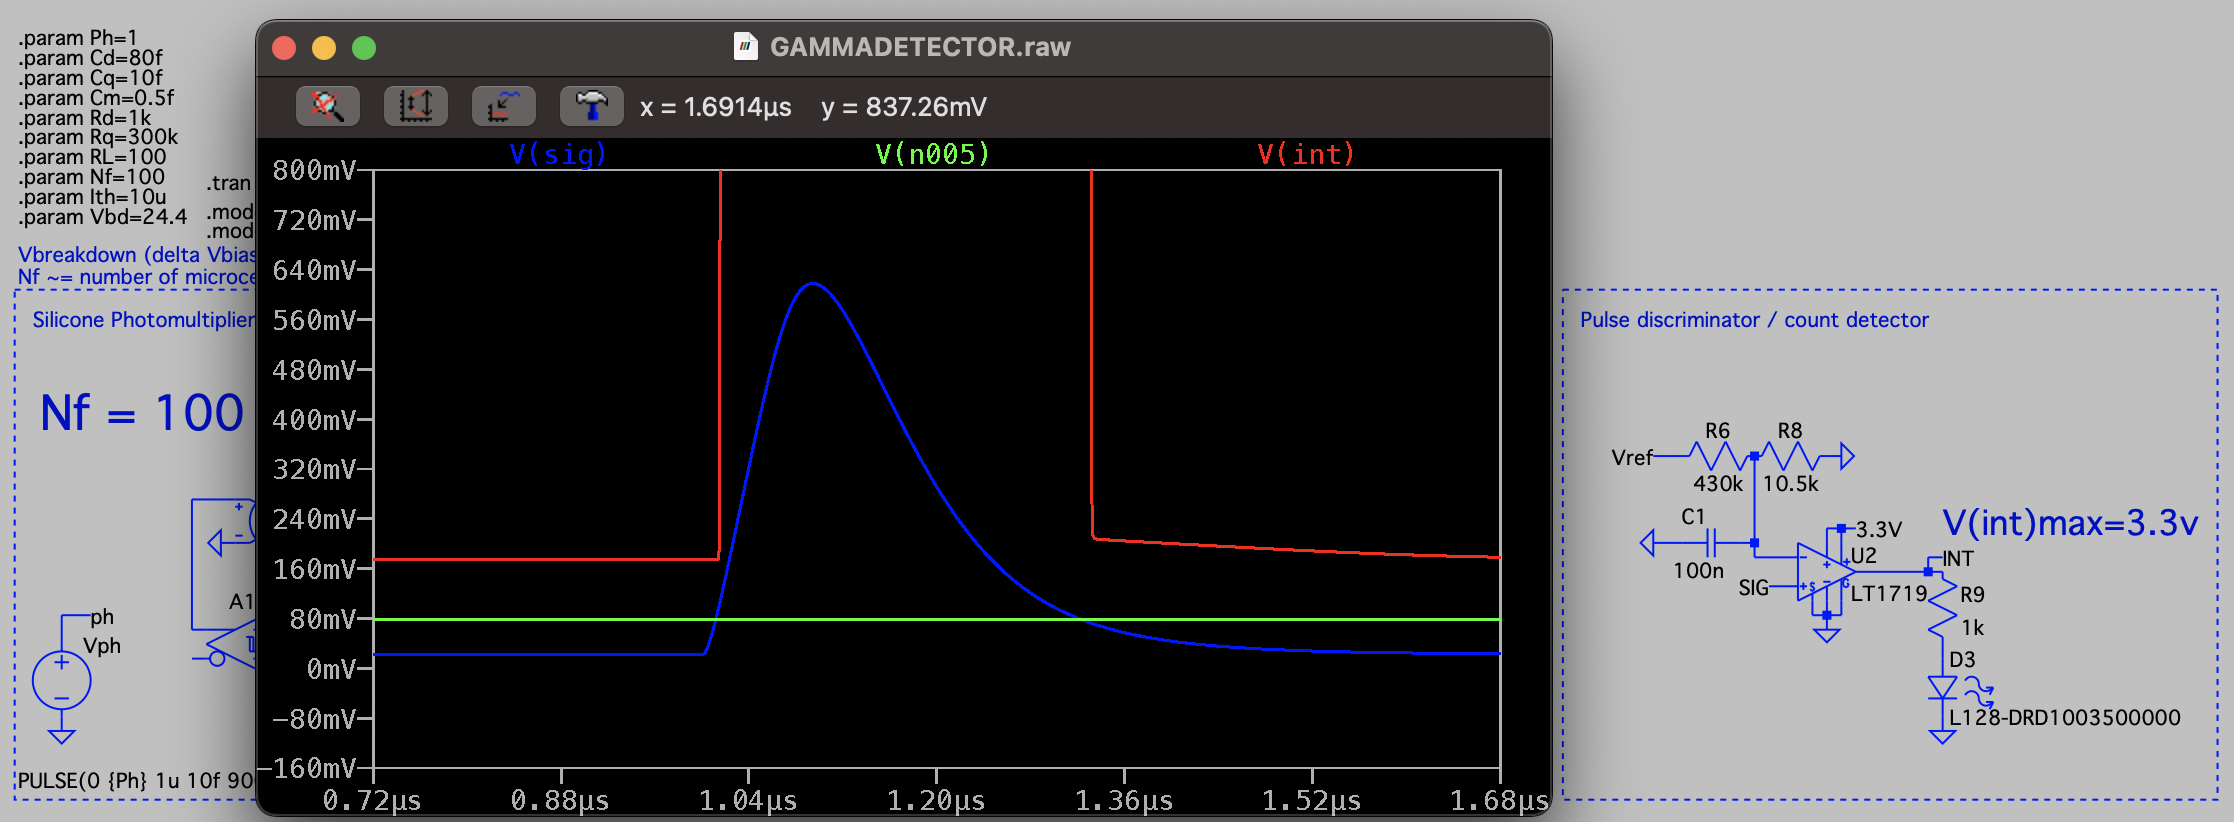
Pulse discriminator:
The pulse discriminator is a comparator circuit responsible for telling us when to trigger measurements. It consists of a reference voltage held just above the level of the signal from the TIA. We want to be able to adjust the reference voltage finely in order to effectively measure low energy particles, so make sure you use something like a 10+ turn pot. The pulse discriminator will trigger whenever the signal goes above the reference voltage, triggering a reading.
Peak detector:
The peak detector circuit, aka the “sample and hold” circuit, is a circuit which samples a signal and outputs the peak value until reset. (In the spice model shown the 100k resistor is really a BJT used for reset, but this interfered with my model.) It is important that the value of the capacitor used to hold the peak value (C3 in SPICE, C12 in my schematic) is sized correctly to avoid undershooting the peak. This output will be sampled by the analog-to-digital converter to determine particle energy.
Analog To Digital Converter (ADC):
An ADC is a circuit which can read voltages and convert them to digital readings. This allows us to sample the output of the peak detector to determine the particle value. These readings will be triggered by the pulse discriminator and sent to a microcontroller. We want to make sure we select a high resolution ADC to capture minute differences in particle energy level. ADC precision is given in bit resolution, meaning how many bits do we divide a given measurement range (eg divide 3.3V into 256 8bit steps, 2^8, == couldn’t see differences smaller than ~12.9mV). It’s best to use at least a 12bit ADC, I used 16bit.
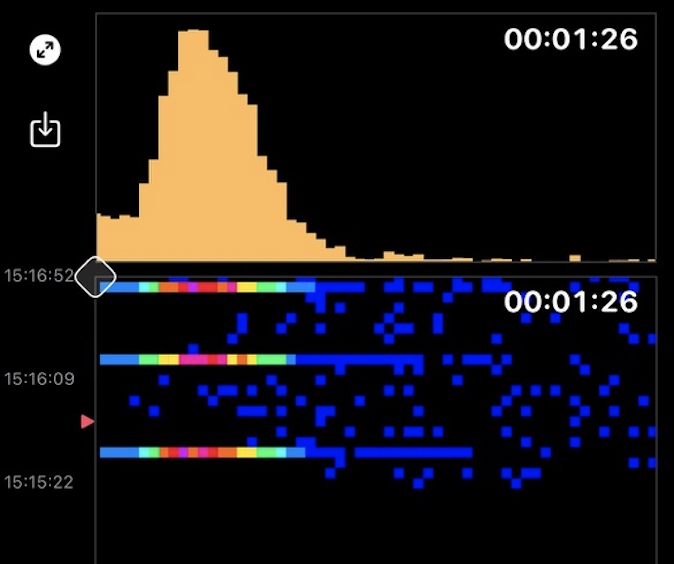
Firmware: reading the spectrum
My board is set up to interface with any microcontroller over SPI. The core loop is simple: the pulse discriminator fires a digital interrupt on the INT pin whenever a particle hits. Your MCU wakes up, reads the peak voltage from the ADC over SPI, then pulls the RST pin high to drain the peak detector capacitor and reset for the next event. Each ADC reading gets binned into a histogram — that histogram is your spectrum. Any MCU with SPI and a GPIO interrupt will work: ESP32, RP2040, STM32, Arduino, whatever you have lying around.
Sourcing guide
Driver board
My board’s design files will be on my GitHub (@eigenlucy) once V2 is ready. In the meantime, the Open Gamma Detector project is an excellent all-in-one alternative and major inspiration for this project. You can also build the amplifier, discriminator, and peak detector on protoboard (it’s much more forgiving than it looks).
Detector pairs
The easiest way to get started is to buy a pre-packaged scintillator+SiPM pair. Atomspectra on eBay sells well-characterized detector pairs at decent prices. If you want to source components separately, the onsemi MICROFC series SiPMs are available on Mouser and Digikey for ~$15-25, and scintillator crystals (NaI(Tl), CsI(Tl), LYSO) show up on eBay regularly.
What to do with it
Collect some background radiation data by letting your detector sit for a few hours, then walk around in grids to map fluctuations in dose rate. This can be used to generate a radiological survey (check my GitHub @eigenlucy).

Bring your detector through the airport X-ray machine or to the dentist with you. X-ray machines emit broad spectrum radiation which shows up as wide pulses on the spectrum.
Look for nearby uranium deposits on mined.org, grab a drone, and go prospecting!

Have fun!
References
- Open Gamma Detector — Open source all-in-one gamma spectrometer by NuclearPhoenix
- Gamma MCA — Web-based multichannel analyzer for spectrum plotting
- onsemi AND9770/D — Introduction to the Silicon Photomultiplier
- Villa et al., “SPICE Electrical Models and Simulations of Silicon Photomultipliers” — IEEE Trans. Nucl. Sci., vol. 62, 2015. Two-macrocell SPICE model with parameterized fired cell count (F) vs total cells (N)
- Glenn F. Knoll, Radiation Detection and Measurement — The textbook on radiation detector physics